 Web Server Statistics for Debian Linux System
Program started at Fri-01-Sep-2017 03:05.
Analysed requests from Sun-06-Aug-2017 06:52 to Fri-01-Sep-2017 03:03 (25.84 days).
 Web Server Statistics for Debian Linux System
Program started at Fri-01-Sep-2017 03:05.
Analysed requests from Sun-06-Aug-2017 06:52 to Fri-01-Sep-2017 03:03 (25.84 days).
(Go To: Top | General Summary | Monthly Report | Daily Summary | Hourly Summary | Domain Report | Organisation Report | Operating System Report | Status Code Report | File Size Report | File Type Report | Directory Report | Request Report)
This report contains overall statistics.
Figures in parentheses refer to the 7-day period ending 01-Sep-2017 03:05.
Successful requests: 4,898 (1,333)
Average successful requests per day: 189 (190)
Successful requests for pages: 1,903 (415)
Average successful requests for pages per day: 73 (59)
Failed requests: 319 (79)
Distinct files requested: 555 (293)
Distinct hosts served: 622 (196)
Corrupt logfile lines: 12
Data transferred: 141.89 megabytes (43.33 megabytes)
Average data transferred per day: 5.49 megabytes (6.19 megabytes)
(Go To: Top | General Summary | Monthly Report | Daily Summary | Hourly Summary | Domain Report | Organisation Report | Operating System Report | Status Code Report | File Size Report | File Type Report | Directory Report | Request Report)
This report lists the activity in each month.
Each unit ( ) represents 50 requests for pages or part thereof.
| month | reqs | pages | |
|---|---|---|---|
| Aug 2017 | 4891 | 1898 |    |
| Sep 2017 | 7 | 5 |  |
Busiest month: Aug 2017 (1,898 requests for pages).
(Go To: Top | General Summary | Monthly Report | Daily Summary | Hourly Summary | Domain Report | Organisation Report | Operating System Report | Status Code Report | File Size Report | File Type Report | Directory Report | Request Report)
This report lists the total activity for each day of the week, summed over all the weeks in the report.
Each unit ( ) represents 15 requests for pages or part thereof.
| day | reqs | pages | |
|---|---|---|---|
| Sun | 439 | 181 |    |
| Mon | 953 | 252 |   |
| Tue | 967 | 655 |    |
| Wed | 791 | 244 |   |
| Thu | 582 | 204 |    |
| Fri | 539 | 188 |    |
| Sat | 627 | 179 |   |
(Go To: Top | General Summary | Monthly Report | Daily Summary | Hourly Summary | Domain Report | Organisation Report | Operating System Report | Status Code Report | File Size Report | File Type Report | Directory Report | Request Report)
This report lists the total activity for each hour of the day, summed over all the days in the report.
Each unit ( ) represents 5 requests for pages or part thereof.
| hour | reqs | pages | |
|---|---|---|---|
| 0 | 102 | 62 |    |
| 1 | 108 | 35 |    |
| 2 | 82 | 30 |   |
| 3 | 60 | 37 |  |
| 4 | 76 | 34 |    |
| 5 | 289 | 199 |   |
| 6 | 174 | 52 |    |
| 7 | 206 | 45 |   |
| 8 | 400 | 219 |    |
| 9 | 235 | 76 |  |
| 10 | 310 | 208 |    |
| 11 | 188 | 79 |  |
| 12 | 172 | 58 |   |
| 13 | 272 | 74 |     |
| 14 | 203 | 60 |   |
| 15 | 208 | 71 |     |
| 16 | 238 | 60 |   |
| 17 | 239 | 54 |    |
| 18 | 138 | 51 |    |
| 19 | 216 | 64 |    |
| 20 | 374 | 99 |   |
| 21 | 223 | 78 |  |
| 22 | 214 | 82 |   |
| 23 | 171 | 76 |  |
(Go To: Top | General Summary | Monthly Report | Daily Summary | Hourly Summary | Domain Report | Organisation Report | Operating System Report | Status Code Report | File Size Report | File Type Report | Directory Report | Request Report)
This report lists the countries of the computers which requested files.
Listing domains, sorted by the amount of traffic.
| reqs | %bytes | domain |
|---|---|---|
| 4898 | 100% | [unresolved numerical addresses] |
(Go To: Top | General Summary | Monthly Report | Daily Summary | Hourly Summary | Domain Report | Organisation Report | Operating System Report | Status Code Report | File Size Report | File Type Report | Directory Report | Request Report)
This report lists the organisations of the computers which requested files.
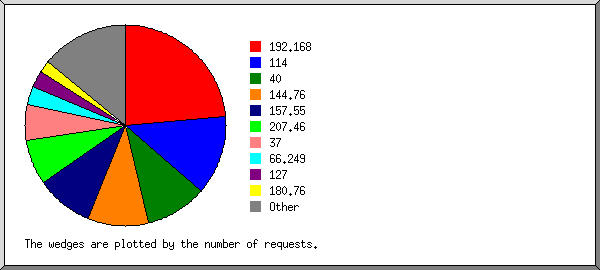
Listing the top 20 organisations by the number of requests, sorted by the number of requests.
| reqs | %bytes | organisation |
|---|---|---|
| 1158 | 20.18% | 192.168 |
| 622 | 13.70% | 114 |
| 486 | 20.01% | 40 |
| 477 | 1.02% | 144.76 |
| 455 | 13.68% | 157.55 |
| 358 | 11.33% | 207.46 |
| 278 | 1.13% | 37 |
| 148 | 10.93% | 66.249 |
| 134 | 0.01% | 127 |
| 91 | 0.22% | 180.76 |
| 50 | 0.06% | 199.30 |
| 48 | 0.13% | 42 |
| 46 | 0.65% | 60 |
| 41 | 0.01% | 126 |
| 34 | 0.05% | 65.55 |
| 29 | 0.02% | 46 |
| 21 | 0.15% | 139.162 |
| 20 | 0.02% | 131.253 |
| 18 | 0.03% | 204.79 |
| 16 | 0.02% | 153.174 |
| 368 | 6.64% | [not listed: 118 organisations] |
(Go To: Top | General Summary | Monthly Report | Daily Summary | Hourly Summary | Domain Report | Organisation Report | Operating System Report | Status Code Report | File Size Report | File Type Report | Directory Report | Request Report)
This report lists the operating systems used by visitors.
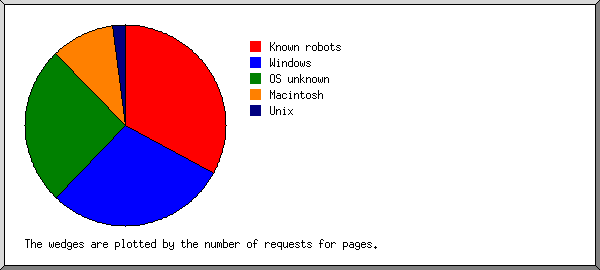
Listing operating systems, sorted by the number of requests for pages.
| no. | reqs | pages | OS |
|---|---|---|---|
| 1 | 662 | 608 | Known robots |
| 2 | 2014 | 538 | Windows |
| 1883 | 485 | Windows 7 | |
| 57 | 33 | Windows NT | |
| 59 | 11 | Windows XP | |
| 6 | 6 | Unknown Windows | |
| 9 | 3 | Windows Vista | |
| 3 | 1569 | 474 | OS unknown |
| 4 | 545 | 190 | Macintosh |
| 5 | 49 | 37 | Unix |
| 49 | 37 | Linux |
(Go To: Top | General Summary | Monthly Report | Daily Summary | Hourly Summary | Domain Report | Organisation Report | Operating System Report | Status Code Report | File Size Report | File Type Report | Directory Report | Request Report)
This report lists the HTTP status codes of all requests.
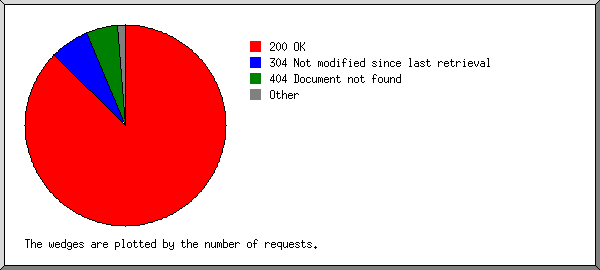
Listing status codes, sorted numerically.
| reqs | status code |
|---|---|
| 4558 | 200 OK |
| 8 | 206 Partial content |
| 332 | 304 Not modified since last retrieval |
| 50 | 400 Bad request |
| 266 | 404 Document not found |
| 3 | 405 Method not allowed |
(Go To: Top | General Summary | Monthly Report | Daily Summary | Hourly Summary | Domain Report | Organisation Report | Operating System Report | Status Code Report | File Size Report | File Type Report | Directory Report | Request Report)
This report lists the sizes of files.
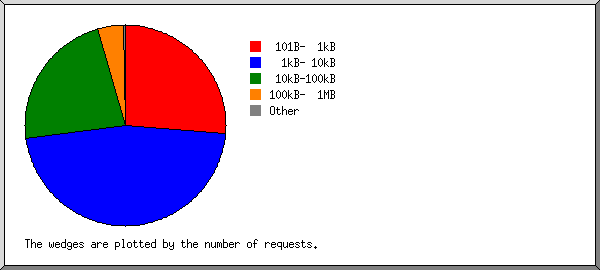
| size | reqs | %bytes |
|---|---|---|
| 0 | 0 | |
| 1B- 10B | 0 | |
| 11B- 100B | 0 | |
| 101B- 1kB | 1287 | 0.36% |
| 1kB- 10kB | 2280 | 5.40% |
| 10kB-100kB | 1114 | 32.44% |
| 100kB- 1MB | 206 | 48.22% |
| 1MB- 10MB | 11 | 13.58% |
(Go To: Top | General Summary | Monthly Report | Daily Summary | Hourly Summary | Domain Report | Organisation Report | Operating System Report | Status Code Report | File Size Report | File Type Report | Directory Report | Request Report)
This report lists the extensions of files.
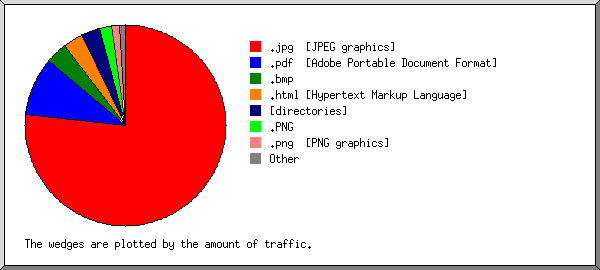
Listing extensions with at least 0.1% of the traffic, sorted by the amount of traffic.
| reqs | %bytes | extension |
|---|---|---|
| 1276 | 76.72% | .jpg [JPEG graphics] |
| 80 | 9.34% | .pdf [Adobe Portable Document Format] |
| 12 | 3.56% | .bmp |
| 1222 | 3.23% | .html [Hypertext Markup Language] |
| 681 | 3.02% | [directories] |
| 40 | 2.05% | .PNG |
| 54 | 1.20% | .png [PNG graphics] |
| 517 | 0.43% | .gif [GIF graphics] |
| 423 | 0.25% | .css [Cascading Style Sheets] |
| 593 | 0.20% | [not listed: 6 extensions] |
(Go To: Top | General Summary | Monthly Report | Daily Summary | Hourly Summary | Domain Report | Organisation Report | Operating System Report | Status Code Report | File Size Report | File Type Report | Directory Report | Request Report)
This report lists the directories from which files were requested. (The figures for each directory include all of its subdirectories.)
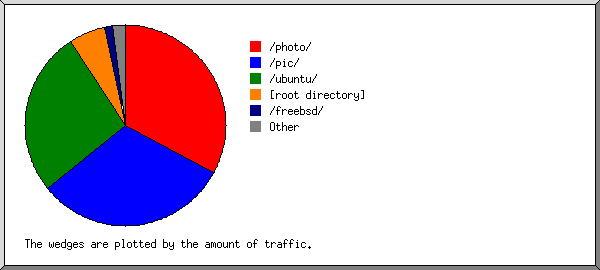
Listing directories with at least 0.01% of the traffic, sorted by the amount of traffic.
| reqs | %bytes | directory |
|---|---|---|
| 501 | 32.81% | /photo/ |
| 881 | 31.30% | /pic/ |
| 512 | 26.74% | /ubuntu/ |
| 1542 | 5.92% | [root directory] |
| 155 | 1.16% | /freebsd/ |
| 45 | 0.77% | /adsl/ |
| 509 | 0.38% | /img/ |
| 37 | 0.25% | /omoumama/ |
| 61 | 0.25% | /CRYSTALMARK/ |
| 423 | 0.25% | /css/ |
| 45 | 0.08% | /cpuz/ |
| 4 | 0.03% | /intra-network.files/ |
| 7 | 0.03% | /excel/ |
| 134 | 0.01% | [no directory] |
| 40 | 0.01% | /cgi-bin/ |
| 2 | [not listed: 2 directories] |
(Go To: Top | General Summary | Monthly Report | Daily Summary | Hourly Summary | Domain Report | Organisation Report | Operating System Report | Status Code Report | File Size Report | File Type Report | Directory Report | Request Report)
This report lists the files on the site.
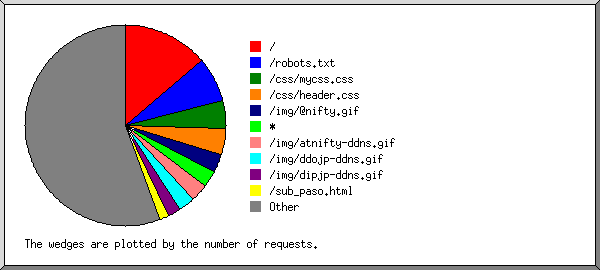
Listing files with at least 20 requests, sorted by the number of requests.
| reqs | %bytes | last time | file |
|---|---|---|---|
| 680 | 3.02% | 1/Sep/17 02:38 | / |
| 355 | 0.07% | 1/Sep/17 01:03 | /robots.txt |
| 218 | 0.14% | 31/Aug/17 19:00 | /css/mycss.css |
| 205 | 0.11% | 31/Aug/17 19:00 | /css/header.css |
| 141 | 0.10% | 31/Aug/17 19:00 | /img/@nifty.gif |
| 134 | 0.01% | 30/Aug/17 23:03 | * |
| 134 | 0.10% | 31/Aug/17 19:00 | /img/atnifty-ddns.gif |
| 134 | 0.10% | 31/Aug/17 22:09 | /img/ddojp-ddns.gif |
| 100 | 0.07% | 31/Aug/17 12:09 | /img/dipjp-ddns.gif |
| 71 | 0.18% | 31/Aug/17 23:37 | /sub_paso.html |
| 56 | 0.08% | 31/Aug/17 12:09 | /favicon.ico |
| 49 | 0.21% | 31/Aug/17 11:33 | /ubuntu/security-xs36v4-170817.html |
| 39 | 0.16% | 31/Aug/17 09:15 | /ubuntu/sshd-2-170810.html |
| 38 | 0.13% | 30/Aug/17 09:32 | /ubuntu/nas-ups-170802.html |
| 34 | 0.12% | 31/Aug/17 19:45 | /ubuntu/security-ntt-rooter-170825.html |
| 30 | 1.28% | 30/Aug/17 09:32 | /ubuntu/mini-170715-test01.jpg |
| 30 | 1.13% | 30/Aug/17 09:32 | /ubuntu/mini-170715-test02.jpg |
| 30 | 1.40% | 30/Aug/17 09:32 | /ubuntu/mini-170715-test03.jpg |
| 30 | 1.35% | 30/Aug/17 09:32 | /ubuntu/mini-170715-power.jpg |
| 30 | 1.33% | 30/Aug/17 09:32 | /ubuntu/mini-170715-test04.jpg |
| 30 | 1.00% | 30/Aug/17 09:32 | /ubuntu/mini-170715-hddin1.jpg |
| 30 | 1.26% | 30/Aug/17 09:32 | /ubuntu/mini-170715-bolt1.jpg |
| 29 | 1.07% | 30/Aug/17 09:32 | /ubuntu/CrystalDiskMark-170718.jpg |
| 27 | 0.08% | 30/Aug/17 22:52 | /sd-card-111014.html |
| 26 | 0.07% | 1/Sep/17 00:52 | /ubuntu/xs36v4-01.html |
| 25 | 0.05% | 30/Aug/17 22:52 | /170701-palit-gtx1050ti.html |
| 24 | 0.34% | 31/Aug/17 19:45 | /ubuntu/IPv6-setuzoku-google-buffalo-170826-1740.jpg |
| 24 | 0.39% | 31/Aug/17 19:45 | /ubuntu/IPv6-setuzoku-plala-buffalo-170826-1737.jpg |
| 22 | 0.04% | 31/Aug/17 17:45 | /071223-gf-p86gt-ge.html |
| 2123 | 84.58% | 1/Sep/17 01:03 | [not listed: 524 files] |